


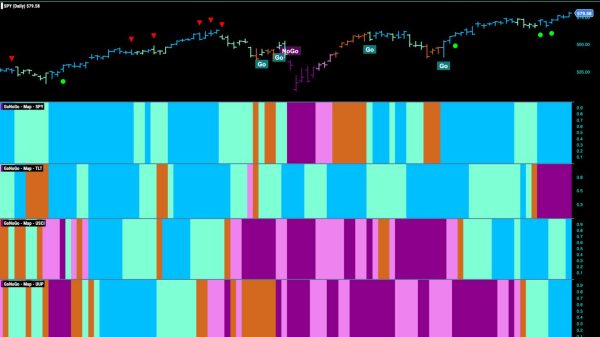

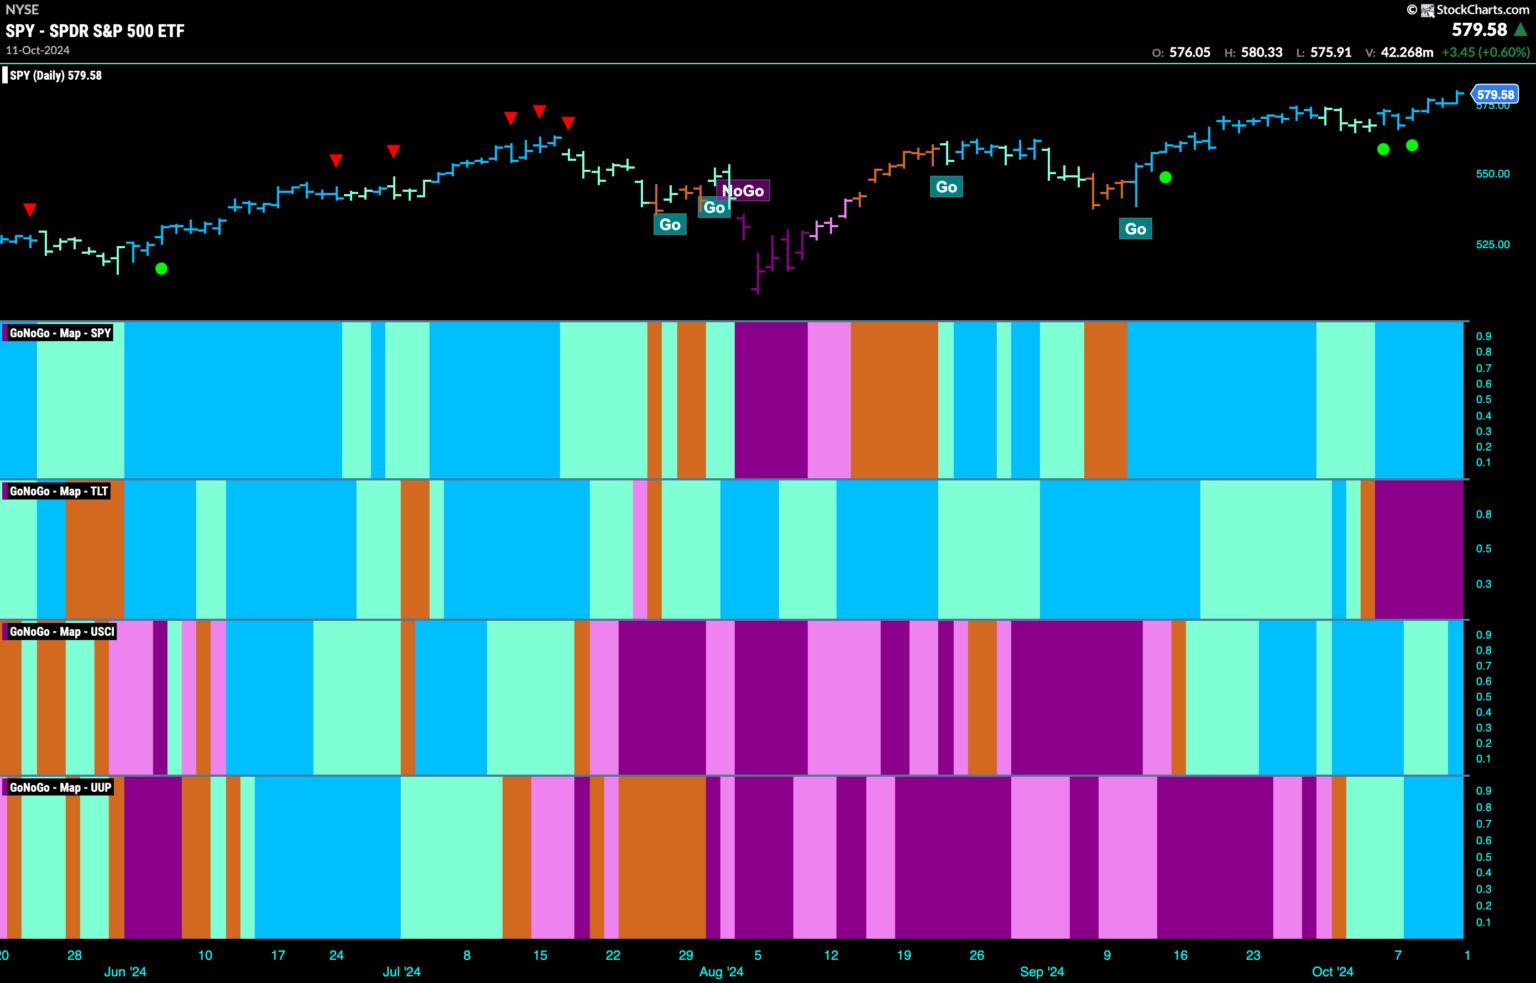
Good morning and welcome to this week’s Flight Path. Equities saw the “Go” trend not just survive but stay strong this week as the indicator painted a week of uninterrupted bright blue bars. Treasury bond prices stayed in a strong “NoGo” trend this week with consecutive purple bars. The U.S. commodity index is seeing its “Go” trend strengthen with a strong blue bar and the dollar seems set in its “Go” trend as well.
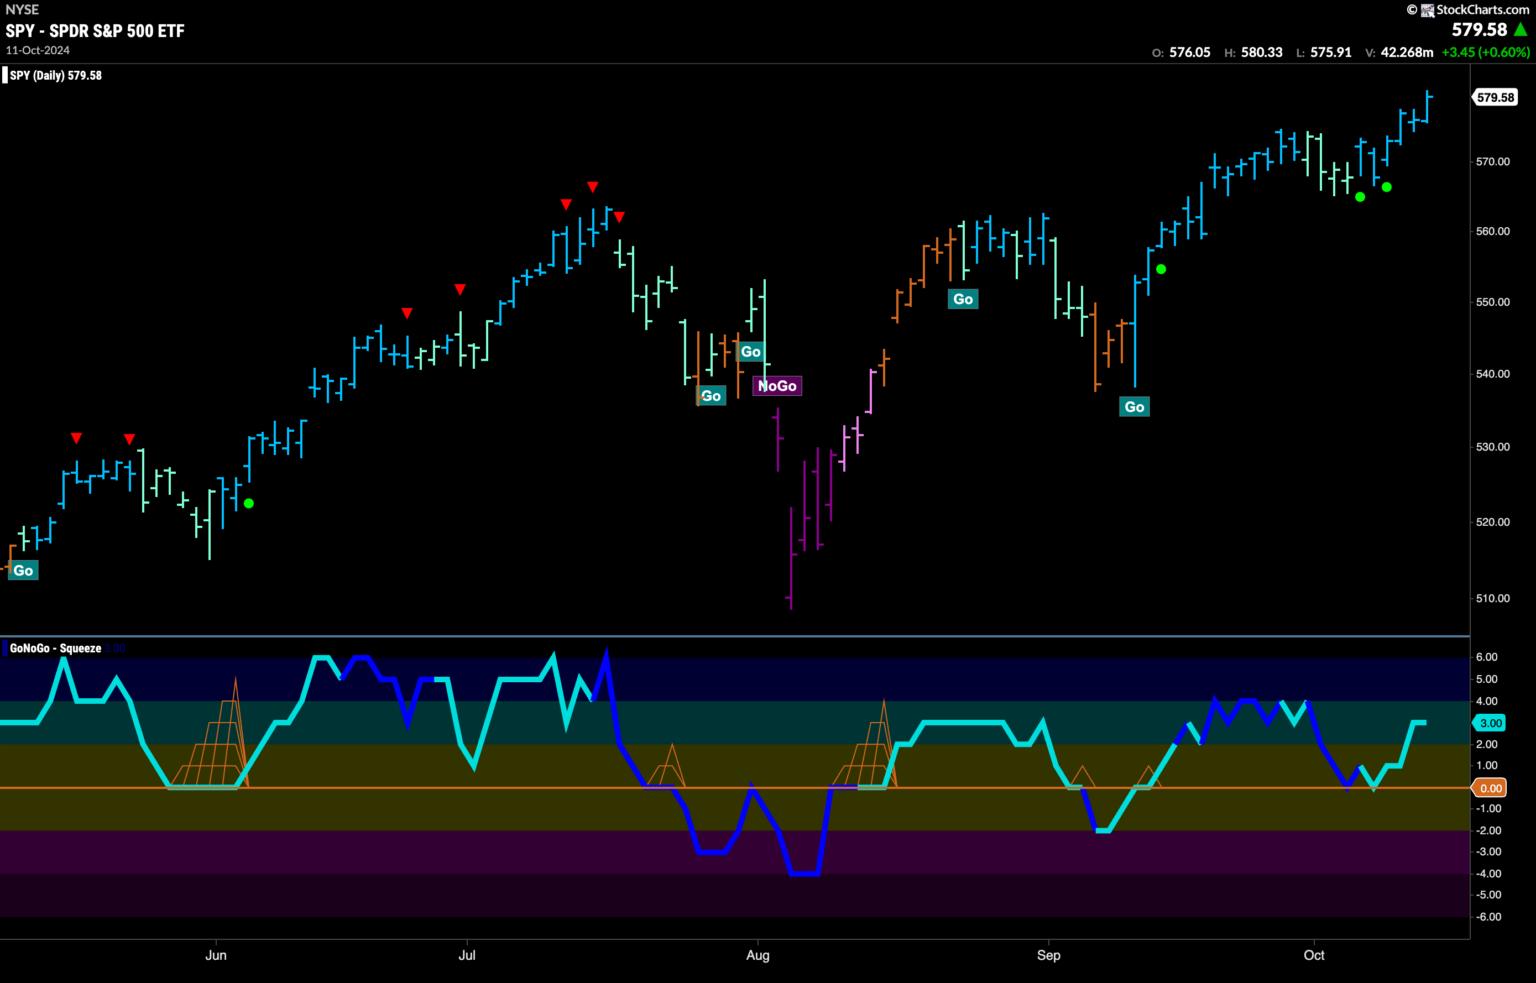
$SPY Able to Set New Higher High
The GoNoGo chart below shows that resurgent strength has pushed price to new highs on strong blue “Go” bars. This came after GoNoGo Oscillator found support twice in quick succession at the zero line. This caused the chart to show multiple Go Trend Continuation Icons and that new momentum in the direction of the trend was enough to push price higher.
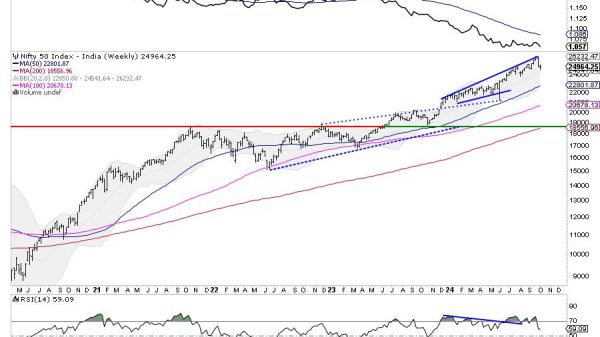
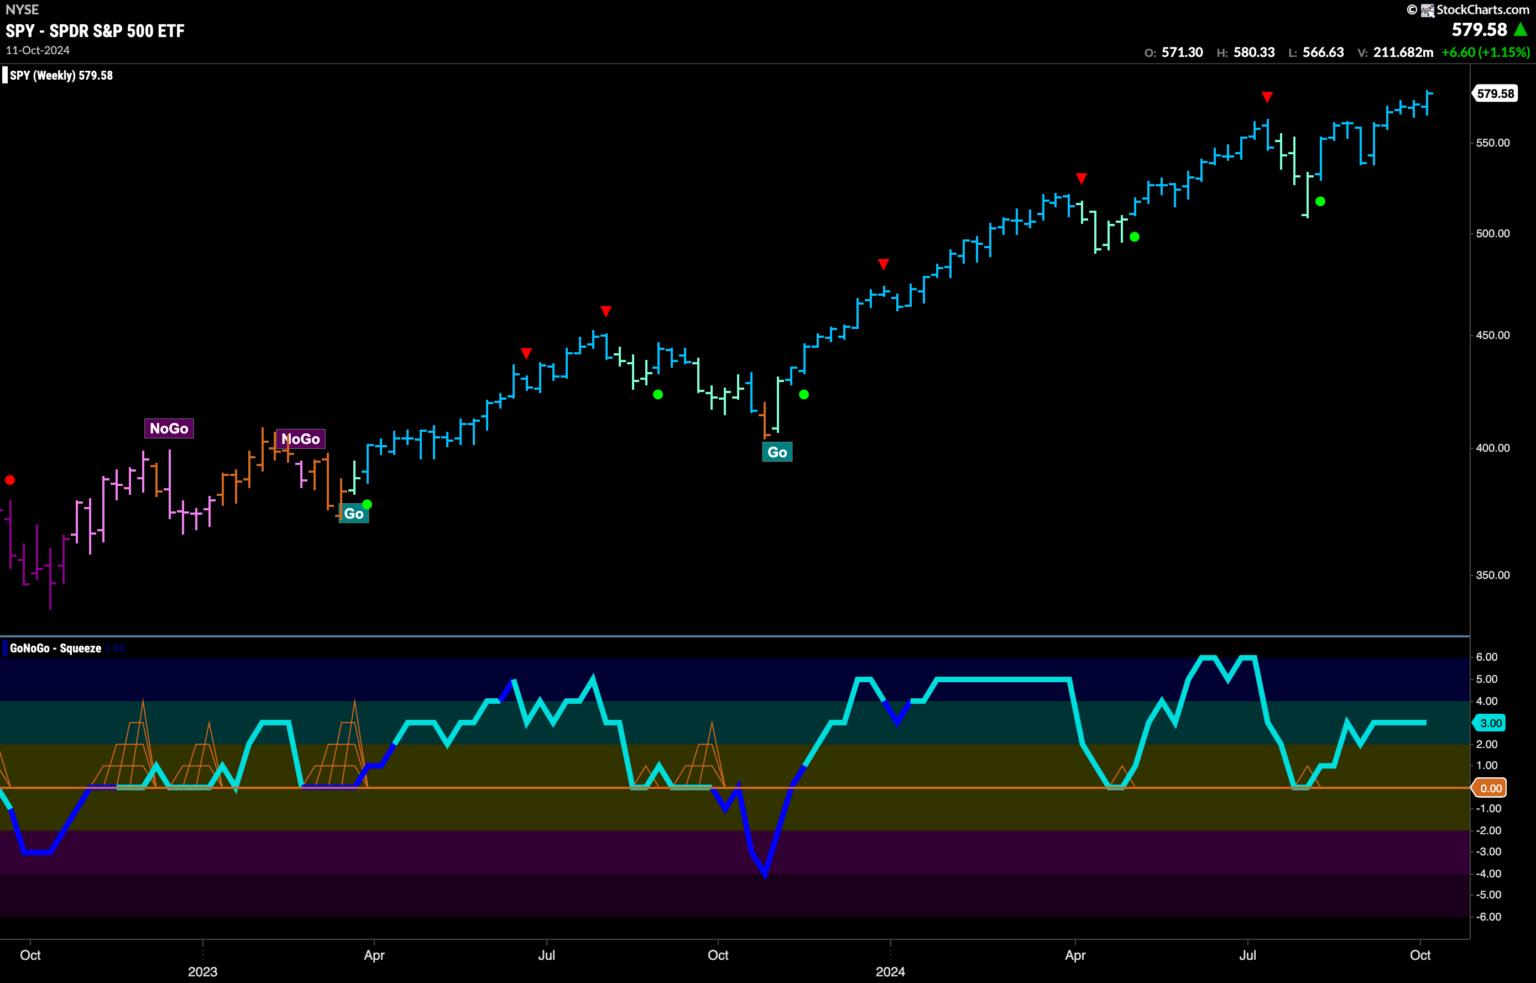
The longer time frame chart shows us that GoNoGo Trend painted another strong blue “Go” bar this past week and we see another higher close on this weekly chart. We are now in a period of consecutive strong blue bars as the trend continues higher. Having taken out the prior high we turn our eye to the oscillator panel where we see that momentum is in positive territory but not yet overbought.
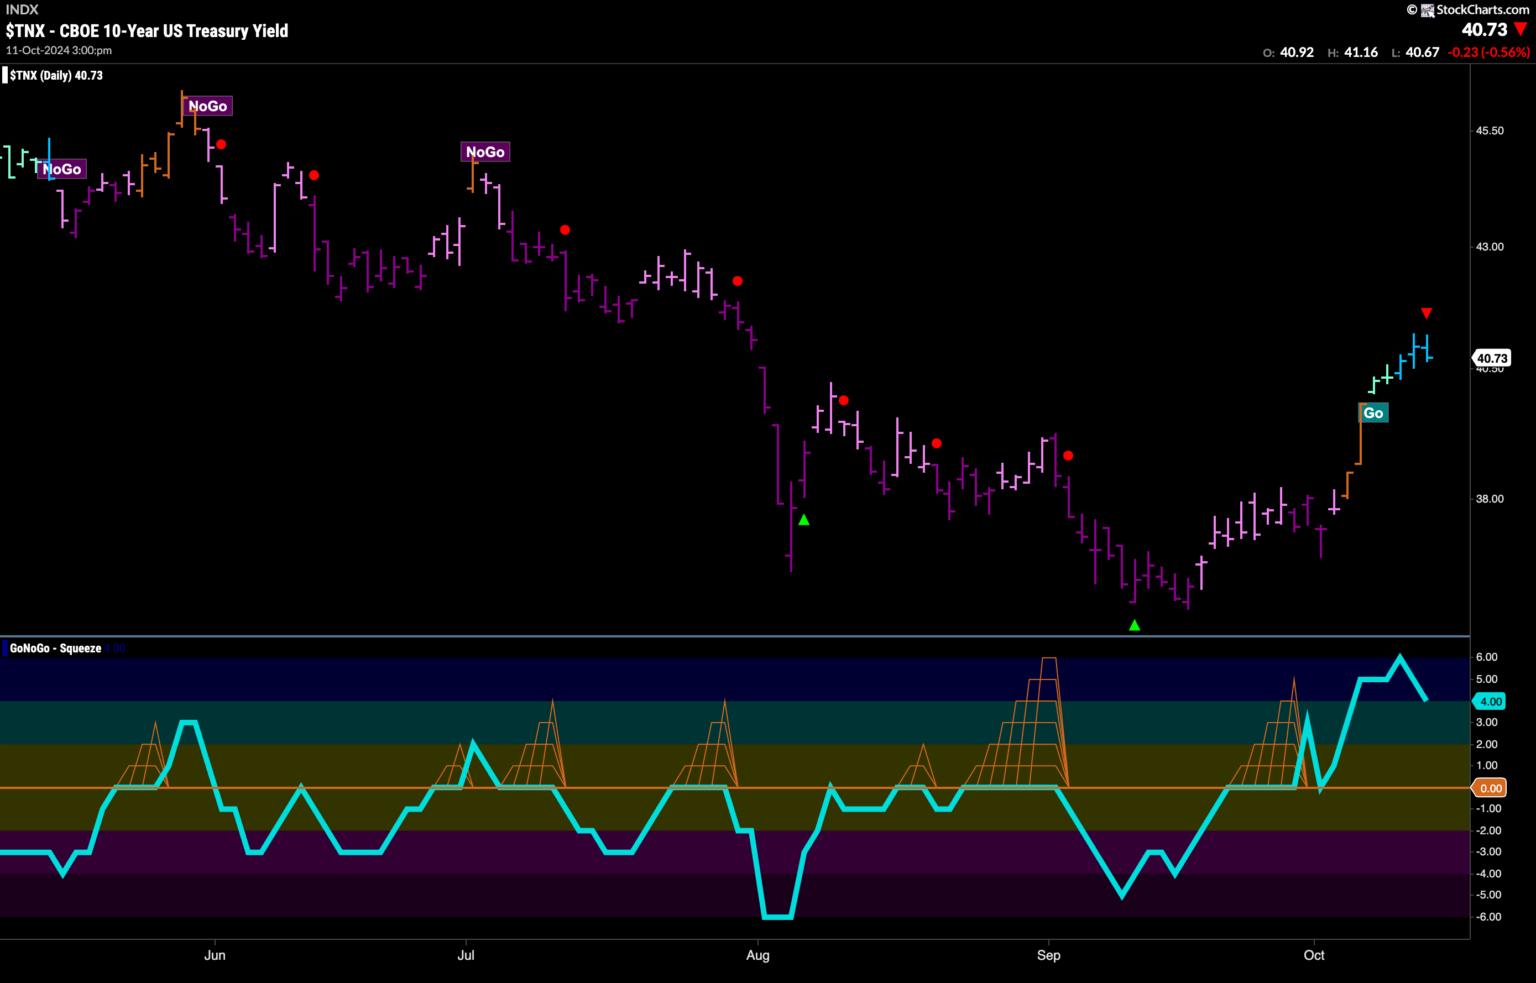
New “Go” Trend Strengthens in Yields
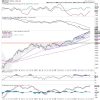
Treasury bond yields are in a “Go” trend now that has seen the indicator move through aqua bars to stronger blue “Go” colors. This comes as price closes in on some potential resistance from previous lows in the last “NoGo” trend. GoNoGo Oscillator is coming out of overbought territory and so we see a Go Countertrend Correction Icon warning us that price may struggle to go higher in the short term. We will then watch to see what happens should the oscillator close in on the zero line.
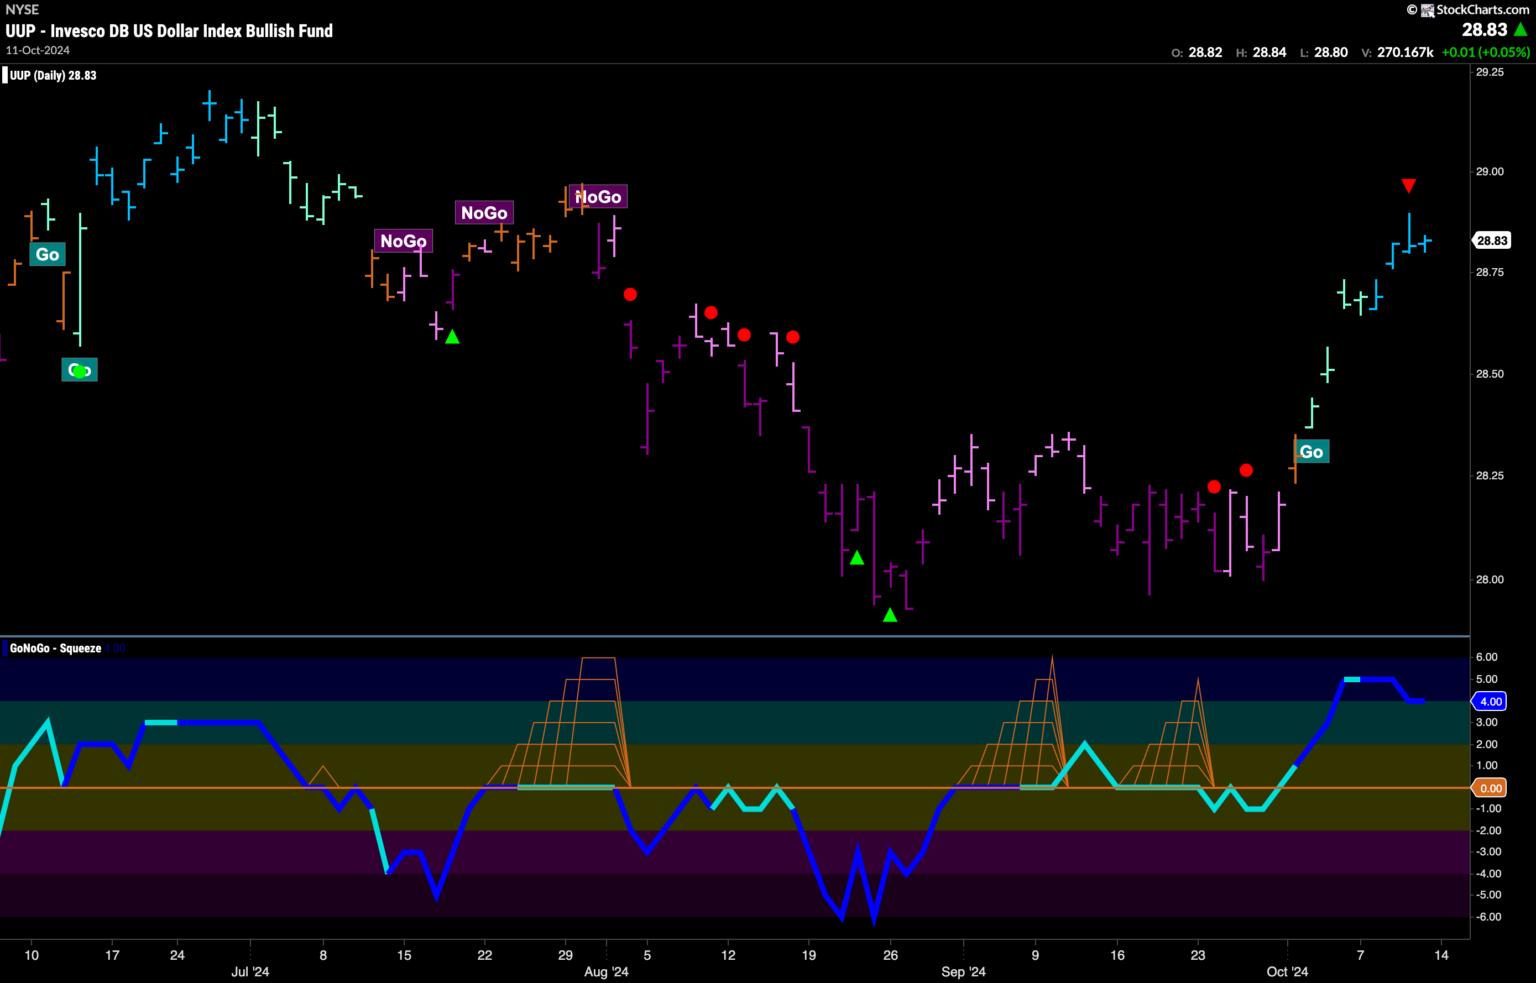
The Dollar Races Higher in New “Go” Trend
Price continued to climb this week as it raced through aqua bars and into bright blue “Go” colors. As GoNoGo Oscillator fell from overbought levels, we see that there is a Go Countertrend Correction Icon that indicates price may struggle to go higher in the short term and we will watch to see if it can consolidate at these elevated levels without falling too much from the high.